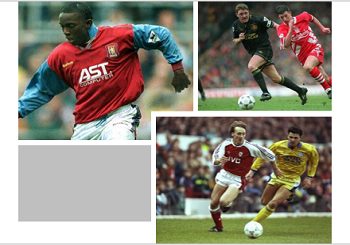
Football League Composite Top Flight Table for the 1990s, My Football Facts

Combined English Football League Top Flight 1990s

HomeEngland Footy Football League

Combined Table for all 34 clubs which participated in the Top Flight of English Football League
during the 1990s from season 1989-90 to 1998-99. Three points for a win awarded for all matches.

Top Flight in the 1990s – Seasons 1989-90 to 1998-99

Pos Club Pld Home Away F A GD Pts
W D L F A W D L F A
1

Manchester United Results

Manchester United 396 129 49 20 375 128 89 60 49 318 236 693 364 329 762
2

Arsenal Results

Arsenal 396 114 56 28 360 149 74 64 60 232 183 592 332 260 682
3

Liverpool Results

Liverpool 396 125 43 30 396 171 63 63 72 260 255 656 426 230 670
4

Aston Villa Results

Aston Villa 396 101 50 47 300 199 60 53 85 204 250 504 439 65 586
5

Chelsea Results

Chelsea 396 93 63 42 309 214 57 57 84 239 299 548 513 35 570
6

Leeds

Leeds United 358 99 49 31 295 150 50 59 70 212 248 507 398 109 555
7

Tottenham Results

Tottenham Hotspur 396 83 55 60 300 248 56 56 86 233 290 533 538 -5 528
8

Wigan Results

Wimbledon 396 79 58 61 270 235 53 68 77 221 302 491 537 -46 522
9

Everton Results

Everton 396 84 57 57 283 210 44 55 99 206 306 489 516 -27 496
10

Sheffield Wednesday

Sheffield Wednesday 358 78 58 43 273 205 47 46 86 195 278 468 483 -15 479
11

English Football

Coventry City 396 76 63 59 239 210 39 60 99 181 315 425 508 -83 468
12

Southhampton Results

Southampton 396 85 52 61 293 247 37 49 112 210 357 503 604 -101 467
13

Blackburn Rovers Results

Blackburn Rovers 278 83 26 30 256 142 39 48 52 153 173 409 315 94 440
14

Nottingham Forest

Nottingham Forest 316 65 47 46 224 187 40 44 74 185 255 409 442 -33 406
15

New Castle United Football Results

Newcastle United 236 73 25 20 237 108 35 36 47 134 155 371 263 108 385
16

Manchester City Results

Manchester City 282 62 43 36 205 154 32 44 65 143 221 348 375 -27 369
17

QPR Results

Queens Park Rangers 282 59 39 43 213 178 37 39 65 148 198 361 376 -15 366
18

West Ham United Results

West Ham United 278 61 37 41 200 164 30 36 73 112 211 312 375 -63 346
19

Norwich City Results

Norwich City 244 49 42 31 164 143 31 29 62 131 206 287 349 -62 311
20

Crystal Palace Results

Crystal Palace 240 40 41 39 135 152 37 29 54 129 197 261 349 -88 301
21

Derby

Derby County 190 40 25 30 134 116 18 24 53 83 151 217 267 -50 223
22

English Football

Sheffield United 164 34 25 23 109 88 17 19 46 88 143 197 231 -34 197
23

Leicester

Leicester City 156 25 27 26 96 103 18 22 38 86 118 182 221 -39 178
24

Middlesborough Results

Middlesbrough 156 31 22 25 119 97 13 26 39 69 142 188 239 -51 177
25

Oldham Athletic results

Oldham Athletic 126 26 19 18 113 99 10 13 40 55 110 168 209 -41 140
26

Ipswich

Ipswich Town 126 18 20 25 74 88 10 18 35 47 118 121 206 -85 122
27

English Football

Luton Town 118 25 20 14 71 53 5 12 42 53 136 124 189 -65 122
28

Sunderland Results

Sunderland 76 13 12 13 35 34 5 8 25 38 79 73 113 -40 74
29

Bolton Wanderers Results

Bolton Wanderers 76 12 12 14 41 53 5 6 27 39 79 80 132 -52 69
30

Charlton

Charlton Athletic 76 8 13 17 38 45 7 8 23 34 68 72 113 -41 66
31

Notts County

Notts County 42 7 5 9 24 29 3 5 13 16 33 40 62 -22 40
32

Barnley

Barnsley 38 7 4 8 25 35 3 1 15 12 47 37 82 -45 35
33

Swindon

Swindon Town 42 4 7 10 25 45 1 8 12 22 55 47 100 -53 30
34

Milwall

Millwall 38 4 6 9 23 25 1 5 13 16 40 39 65 -26 26
Three Points for a Win awarded for all matches

English Football League Top-Flight 1950s

English Football League Top-Flight 1960s

English Football League Top-Flight 1970s

English Football League Top-Flight 1980s

English Football League Top-Flight 1990s

Archives